LTV 1200 Ventilator Dashboard Technology
It is important for me to outline the journey that lead to the development of the LTV 1200 Dashboard. When a serious brain injury forced my family to be in the midst of critical care for my son we had to adapt to our new found reality. It has been a rollercoaster of emotions not knowing what new medication or surgery would be needed to help keep him stable so he can continue with his recovery.
He was intubated from the beginning of his hospital stay as he could not breathe on his own. Then we had a tracheotomy so that he could breathe better and not have tubes shoved down his throat as they were causing other problems. My wife and I were trained on how to perform CPR, know how to read the signs of stress due to lack of breathing, and how to “bag” (valve mask ventilation) should he need it.
In the midst of all this chaos we were introduced first to the LTV 1150 Ventilator. As someone who works in health care I was curious about the device and many of the other ancient looking ones in his room; at least one of his med pumps had WiFi – which I’m not sure why. The preferred ventilator the hospital had been using was recalled for some defect, so they went back to their good old reliable ones – the LTVs. When ours broke down we were given the LTV 1200, which looked similar in design but had a bit more purple


How It Began
As our sons health progressed it became crucial that he learn to breathe on his own. We began “sprinting” him i.e. taking him off the vent to see how well he could breathe without aid. While sprinting, we would look for any signs of stress and if he started to de-sat i.e. his oxygen in his blood start going down. A good range is btw 91-100 and anything below that would mean we would need to stop. We also reduced some settings on the vent so we could make him work for each breath rather than being assisted. One way to do this is go into CPAP or BIPAP mode where the machine will monitor breathes per minute (bpm) and if his bpm started to fall would initiate a breathe to keep it at a certain number. We set his to bpm support to 6 while awake, then 10 while asleep as he would not initiate his breathe easily.
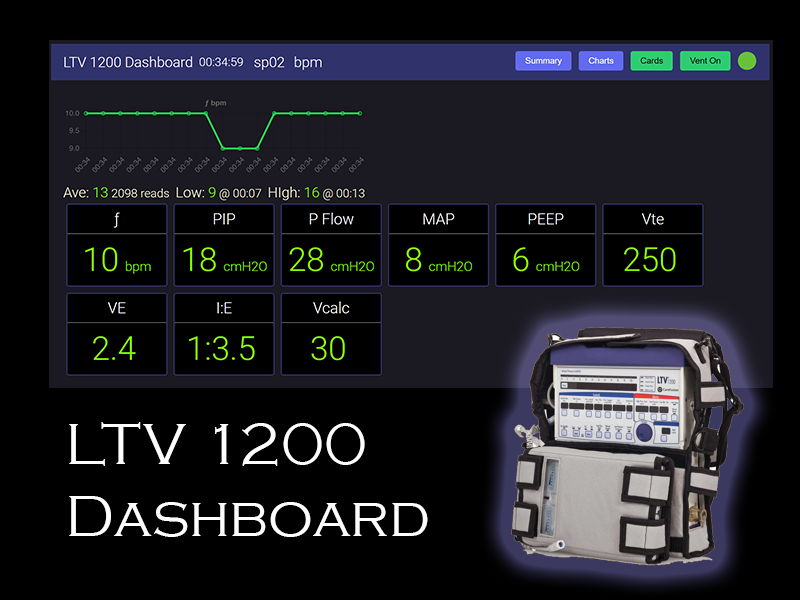
This led me to want to know what was he doing at night? Did his bpm drop below ten and he needed assistance or was it above 10 while he slept? The LTV 1200 does not have any tracking mechanism so I wondered if there was a way to get the data off the machine somehow. I noticed it has a COM RJ11 port on the side and I wondered why this would need a modem port for communication? So I searched online for LTV 1200 and its communications port and that lead me to this Github project from a group of students from MIT
https://gitlab.cba.mit.edu/jakeread/ltv-1200-display
Turns out that port was not a modem port but a serial rs232 port and this gitlab project was working on getting data off it to a display. I looked at the code and saw it had only gone as far as plotting the flow, volume, and some other breathing realted stats but not what I was looking for. Thankfully the team had access to the USB Serial Protocal manual and I was able to dig deeper into it…and I found what I was looking for.
The Prototype
Thankfully I have experience dealing with rs232 devices and immediately thought of using a raspberry pi like they did but not the way the project implemented things. Rather than going from a RS232 device to the pi’s TTL UART pins, I opted to go the USB route – plus plugging a USB is easier, you do it right at least 50% of the time the first time. So I came up with this plan of implementation

The vent would send the data to the pi via the Serial to USB cable I purchased – there many clones outs there, I opted for one with an FTDI chip and it works. The generic one would stop getting data or just simply not work. The program running on the pi to read the data is a NodeJS application that also serves as a web server to allow any one on the network to view the data by going to the pi’s address. After setting up the pi, installing my go to backend framework nodejs and some other dependencies, I was able to produce a working prototype:

This Dashboard can be viewed from any browser that is on the same network as the pi and all information is sent to all browsers connected to the pi server in real time. The pi also stores each data value each second to a daily file, that I can look at to see what the trends are for my son. The biggest gain for me was being able to tell if he’s breathing good or not by tracking his bpm and seeing what his Ave bpm was while he slept.

I now understand why most hospital screen clusters have a black background. It makes it a lot easier to read the content and you don’t have a huge glow in the dark screen at night. So I changed the background to black

The Aftermath
It has been working great for the couple of weeks I’ve had it on. The respiratory techs that come to check the vent have shown their gratitude of being able to see all the stats they have to chart without having to click through the menu on the vent itself. I also discovered that Carefusion had a similar screen that would show what I was looking for but since they have been bought out they do not make this vent or the screen anymore.


I plan to write up an in depth breakdown of how it all works and some of the other gotcha’s I encountered on the way. My next step is to integrate the dashboard with the SPO2/Heart rate monitor in his room so I might be able to show some correlation between his breathing, oxygen level and HR. There is more work to be done. Feel free to leave a comment or contact me for more info